How to use
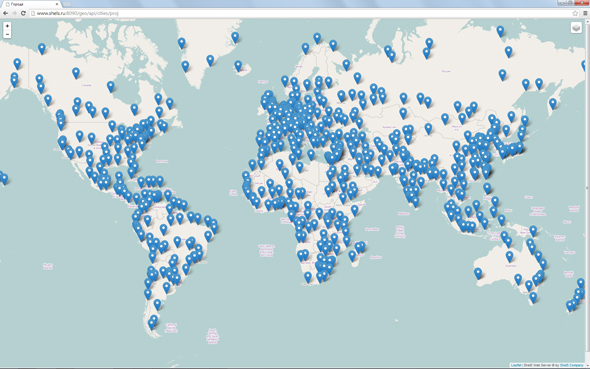
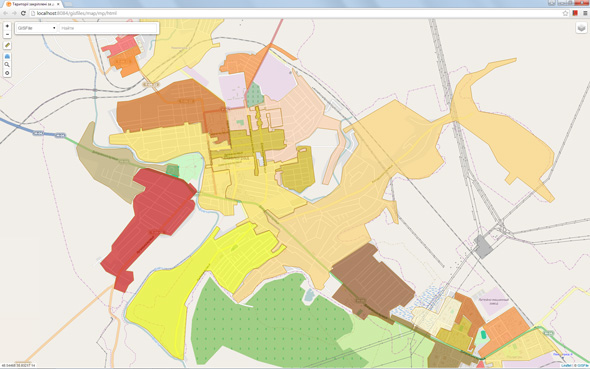
Let us start with the most simple. How to display objects of the layer? There are two options of displaying on the map: mapping of vector objects and tiles. The rendering of the map on the entire screen is possible in the web browser with the help of referencing with a set parameters. Use tags Iframe, JavaScript, or API functions for map displaying in a web page or application.
Vector objects and tiles
Vector objects can be displayed on the base layer OpenStreetMap, Google Map, cadastral map and others. The vector objects are points, lines and polygons. Vector objects can be specified by the color, filling, object attributes. The object attributes are used for analytics, searching and displaying the information about an object on the map. Tiles layer is the substrate, which is a set of images. The base layers OpenStreetMap, Google Map, raster layers, vector layers and maps which can dynamically transform into tiles on the service are related to the similar layer.
Displaying mark on the map
http://gisfile.com/api/html?icon=icon-olive&name=Paris&lat=49.03787&lon=2.28516&z=5
| Parameter | Description | Format | Example |
|---|---|---|---|
| icon | displays a mark on the map and permits to specify the name of the icons by specified latitude and longitude coordinates | GET parameters (if parameter not specified, mark is not displayed)) | icon=icon-green |
| name | name of the object | GET parameters (displayed when you click on mark) | name=Hello world |
| xname | name of the object in Hex format | GET parameters (used instead of the name, if the encoding is not UTF-8) | xname=d09fd180d0b8d0b2d0b5d18220d09cd0b8d1802021 |
| note | object description | GET parameters (displayed when you click on mark) | note=Welcome! GISFile |
| xnote | description of the object in Hex format | GET parameters (used instead of the name, if you use special characters) | xnote=d09fd180d0b8d0b2d0b5d182d181d182d0b2d183d0b5d0bc2021 |
| lon | longitude | GET parameters | lon=49.03787 |
| lat | latitude | GET parameters | lat=2.28516 |
| z | map scale | GET parameters (default 6) | z=5 |
| s | displaying the search panel of objects | GET parameters (default 1) | s=0 |
Display of objects on the map
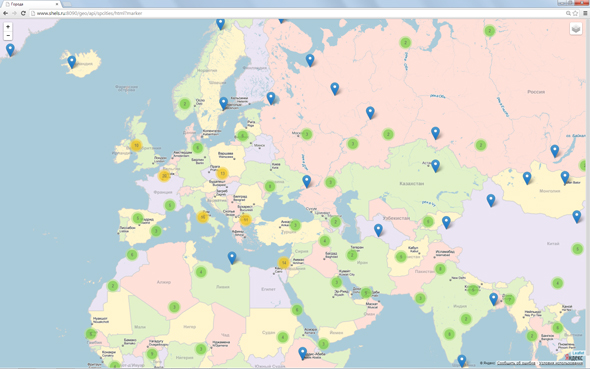
http://gisfile.com/layer/spcities/html?marker&lat=31.95216&lon=5.62500&z=2
http://gisfile.com/map/usa/html
| Parameter | Description | Format | Example |
|---|---|---|---|
| marker | grouping displaying of objects | GET parameters | http://gisfile.com/layer/spcities/html?marker |
| icon | allows to specify the name of icon for the point | GET parameters | http://gisfile.com/layer/spwifi/html?icon=icon-green |
| lon | longitude | GET parameters | lon=49.03787 |
| lat | latitude | GET parameters | lat=2.28516 |
| z | map scale | GET parameters (default 6) | z=5 |
| s | displaying the search panel of objects | GET parameters (default 1) | s=0 |
Displaying tiles on the map
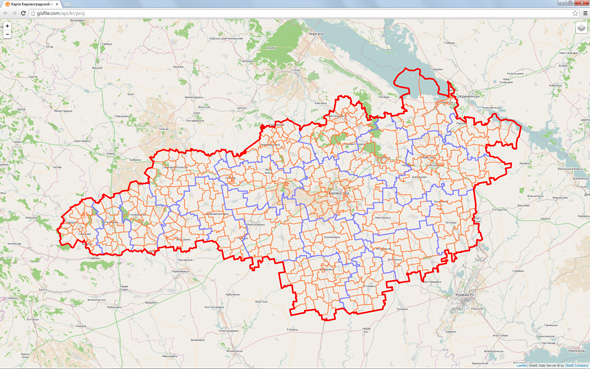
http://gisfile.com/layer/tilekr100/tile&lat=48.51115&lon=32.22427&z=10
http://gisfile.com/map/ukraine/tile
| Parameter | Description | Format | Example |
|---|---|---|---|
| lon | longitude | GET parameters | lon=49.03787 |
| lat | latitude | GET parameters | lat=2.28516 |
| z | map scale | GET parameters (default 6) | z=5 |
| s | displaying the search panel of objects | GET parameters (default 1) | s=0 |
Object editor
http://gisfile.com/layer/SpatialTest/editor
Displaying a map with a specified set of layers and styles on your Html page
http://gisfile.com/api/html?data=[{"style":{"lat":48.5,"lng":30.4,"zoom":6}},{"layer":"SpatialReg","show":true,"type":"Overlay","style":{"color":"fff","weight":1,"fillOpacity":0.7}},{"layer":"SpatialArea","show":true,"type":"Overlay","style":{"color":"800026","weight":2,"fillColor":"none"}}]
Map displaying with the help of JavaScript API
The description of map displaying on the Web page or in the application using JavaScript API
Html and JavaScript code receiving
Receive Html and JavaScript code for displaying of map on the Web page or in the application Designer of maps
Map on the external Html page
You have the opportunity to insert a link with a set of parameters in JSON format. These parameters describe the displayed layers, colors, line thickness, filling, the displaying of information window and other parameters.
parameters of map (style)
| Parameter | Description | Format | Example |
|---|---|---|---|
| style | parameters of map | json parameters | {"style":{"lat":46.5,"lng":30.4,"zoom":10}} |
| style.lat | latitude (WGS 84) | fractional number | "style":{"lat":46.5} |
| style.lng | longitude (WGS 84) | fractional number | "style":{"lng":30.4} |
| style.zoom | scale of | integer (from 1 to 19) | "style":{"zoom":10} |
Parameters layer (layer)
| Parameter | Description | Format | Example |
|---|---|---|---|
| layer | layer | text | "layer":"SpatialReg" |
| show | visibility of the layer (loading when opening) | logical (default false) | "show":true |
| type | view displaying layer | view (Overlay - layer objects, TileLayer - tiles vector layer, TileImage - tiles raster layer) |
"type":"Overlay" |
| name | name of layer | text | "name":"The areas" |
| style | display parameters for all objects | json parameters | "style":{} |
| style.color | color of lines | HEX string | "style":{"color":"800026"} |
| style.weight | thickness of lines | integer | "style":{"weight":2} |
| style.popup | displaying information about the object | logical value (enabled by default) | "style":{"popup":false} - disable the display |
| style.fillColor | fill color of polygons | HEX string | "style":{"fillColor":"BD0026"} - fill color "style":{"fillColor":"none"} - without fill |
| style.fillOpacity | transparency fill polygon | a fractional number (from 0 to 1) | "style":{"fillOpacity":0.7} |
| styles | display parameters depending on the value of the specified field | json array | "styles":{"field":"ID_SpatialReg","styles":[]} |
Parameters layer styles (layer.styles)
| Parameter | Description | Format | Example |
|---|---|---|---|
| styles | display parameters | json parameters | "styles":{"field":"id","styles":[]} |
| styles.id | field name | string | "styles":{"field":"id"} |
| styles.styles | array of parameters | json array | "styles":{"styles":[]} |
| styles.styles[].value | field value | any format | {"value":5,"color":"FC4E2A"} |
| styles.styles[].color | fill color | HEX string | {"value":8,"color":"BD0026"} |
http://gisfile.com/api/html?data=[{"style":{"lat":48.5,"lng":30.4,"zoom":6}},{"layer":"SpatialReg","show":true,"type":"Overlay","style":{"color":"fff","weight":1,"fillOpacity":0.7},"styles":{"field":"ID_SpatialReg","styles":[{"value":1,"color":"fcfc7b"},{"value":99,"color":"f8f179"},{"value":148,"color":"FFEDA0"},{"value":198,"color":"FED976"},{"value":247,"color":"FEB24C"},{"value":296,"color":"FD8D3C"},{"value":346,"color":"FC4E2A"},{"value":395,"color":"E31A1C"},{"value":445,"color":"BD0026"},{"value":495,"color":"800026"}]}},{"layer":"SpatialArea","show":true,"type":"Overlay","style":{"color":"800026","weight":2,"fillColor":"none"}}]
Prepared projects
The displaying of prepared project with the prescribed layers and styles of displaying
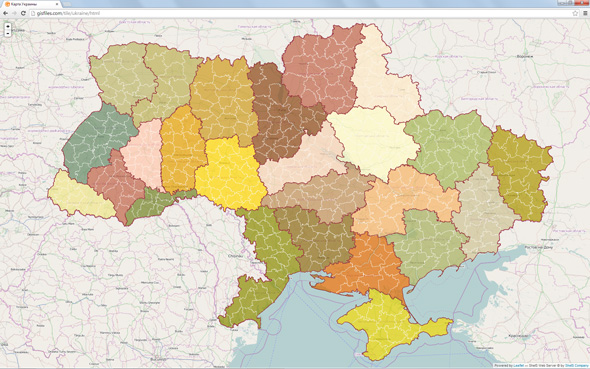
http://gisfile.com/map/ukraine/html
Unlike variant, when you should specify the parameters of displaying the laye in the link, Web server allows the administrator to specify these parameters by default. User should only specify the link with the name of the project.
The connecting of layers to GIS 6 and MapDraw 2
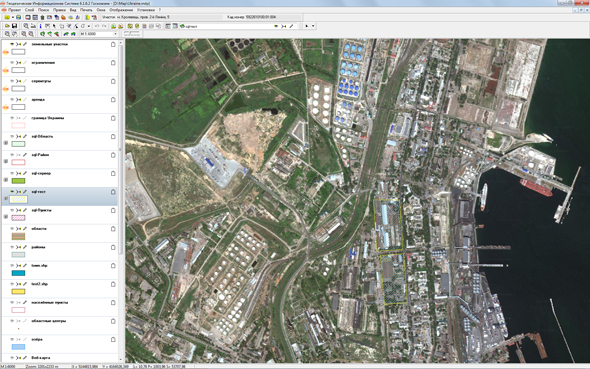
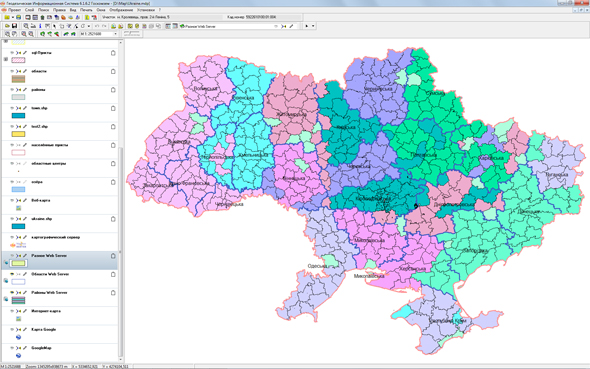
For connecting the layers in GIS6 and MapDraw2 is necessary to create "Layer gisfile.com", enter the link which is specified below in the parameters of the layer with the same name of the later. After these actions, choose the name of layer in the list. Choose a coordinate system which will display the objects of the layer in the tab "Projection".
http://gisfile.com/api
Layer gisfile.com
After the connecting of the layer you can work with it as with other layer. You can make following actions: create, copy, paste, edit, delete, etc. Keep in mind, click "Save layer" in the top panel of buttons to save the changes.
API functions
Getting layer objects in the format GeoJSON
http://gisfile.com/layer/SpatialReg/json
| Link | Description |
|---|---|
| http://gisfile.com/layer/{layer}/json |
Objects layer in JSON formatwhere {layer} - the name of the layer |
| http://gisfile.com/layer/{layer}/{z}/{x}/{y}.png |
mask to display tile layerwhere {layer} - the name of the layer, {z} - scale of, {x}, {y} - tile position |
var geojsonLayer = new L.geoJson();
var map = L.map( 'map').setView([48.60, 31.40], 6);

jQuery.ajax({
   url: 'http://gisfile.com/layer/SpatialReg/json',
   dataType: 'json',
   success: function(response) {
      geojsonLayer = L.geoJson( response).addTo(map);
   }
});
var geojsonLayer = new L.geoJson();
var map = L.map( 'map').setView([48.60, 31.40], 6);

var osm = new L.TileLayer('http://gisfile.com/layer/areas/{z}/{x}/{y}.png');
map.addLayer(osm);
var geojsonLayer = new L.geoJson();
var map = L.map( 'map').setView([48.60, 31.40], 6);

var osm = new L.TileLayer('http://gisfile.com/layer/tilekr100/{z}/{x}/{y}.png');
map.addLayer(osm);
var geojsonLayer = new L.geoJson();
var map = L.map( 'map').setView([48.60, 31.40], 6);

var osm = new L.TileLayer('http://gisfile.com/map/ukraine/{z}/{x}/{y}.png');
map.addLayer(osm);
jQuery.ajax({
   url: 'http://gisfile.com/layers.json',
   type: 'POST',
   dataType: 'json',
   contentType: "application/json; charset=utf-8",
   success: function(response) {
      alert( response);
   }
});
